Yearly TWR, CAGR, and Drawdown — Not Broker P/L
Cash-flow-weighted returns year by year. Index overlay is a separate job — this page is the performance table.
Start Tracking Performance FreeNo credit card required • Works with any broker
Broker P/L Is Not Your Annual Return
Most investors don't know their actual annual returns. They look at their portfolio today, subtract what they invested, and call it a day. But that simple calculation is meaningless.
Here's why: if you deposited €50,000 throughout the year and your portfolio is now worth €55,000, that's not a 10% return. When did you deposit that money? If most of it came in December, you barely had time to invest it. If it all came in January, you had a full year. The timing matters.
Without cash-flow-weighted TWR you cannot even state last year’s return honestly. Overlaying that return on MSCI World is a benchmark comparison — a different screen. This page answers: what was my TWR, CAGR, and max drawdown each year?
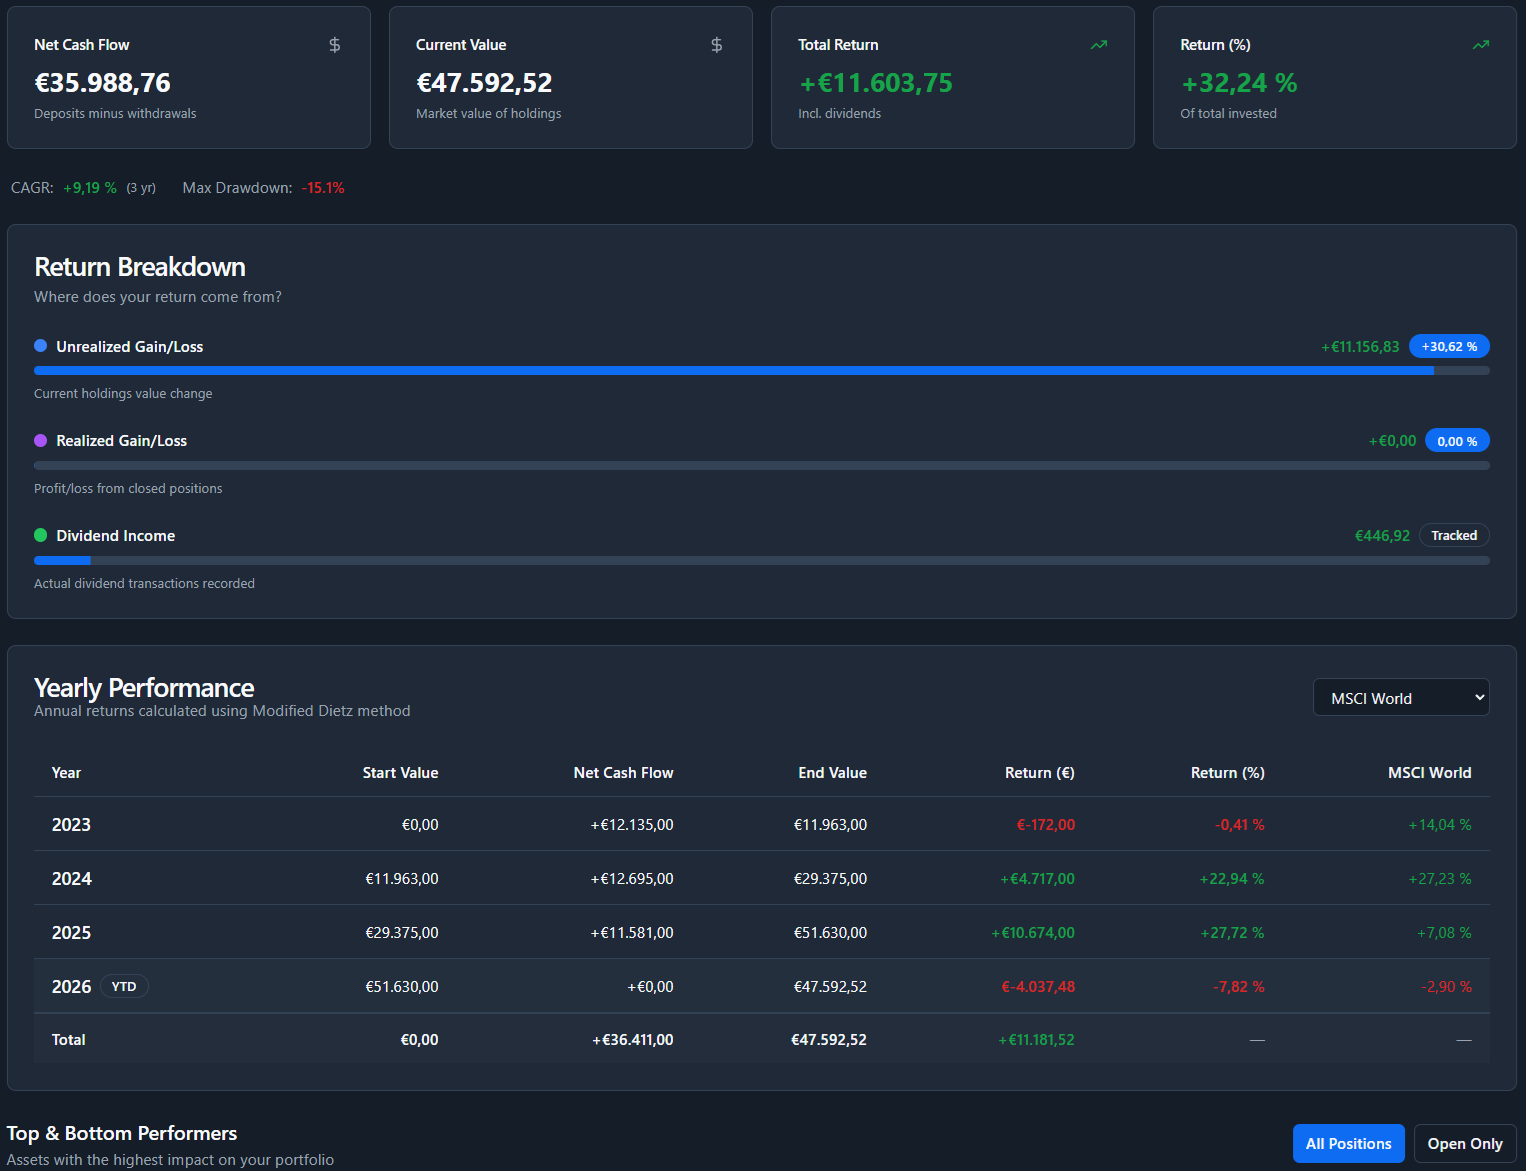
TrackinV’s yearly performance table gives you:
- What was my actual return in 2023, adjusted for deposits and withdrawals?
- What’s my compound annual growth rate over the years?
- What was my worst drawdown and can I handle that risk?
- For “did I beat MSCI World?” go to portfolio benchmark.
Stop guessing. Start measuring. Track your real investment performance year by year.
Yearly Performance Features
Year-by-Year Breakdown
See your start value, net cash flow, end value, and real return for every year since you started investing. Modified Dietz method ensures accuracy even with irregular deposits.
Compound Annual Growth Rate
Your annualized return on deployed capital. Benchmark overlay lives on the portfolio benchmark page — here you get the yearly TWR table, CAGR, and drawdown.
Know Your Risk
See the largest peak-to-trough decline your portfolio has experienced. Essential for understanding your risk tolerance and setting realistic expectations.
How We Calculate Your Returns
TrackinV uses the Modified Dietz method — the same approach used by professional fund managers. It's the industry standard because it accounts for when you deposit or withdraw money during the year.
Unlike simple profit calculations, Modified Dietz weights each cash flow by time. Money that worked for you all year counts more than money you deposited in December. This gives you an accurate return percentage that reflects actual investment skill, not just timing of deposits.
Example: If you invested €10,000 in January and another €10,000 in December, and your portfolio is worth €21,000 at year end — that's not a 5% return on €20,000. The January money worked all year, the December money barely worked at all. Modified Dietz weights each deposit by time to give you the true return: closer to 8-9%.
TrackinV vs. Manual Tracking
Using Spreadsheets
- ✗Manual calculations prone to errors
- ✗No cash flow weighting
- ✗No benchmark data
- ✗Can't handle multiple brokers
- ✗Hours of work per year
Using TrackinVRecommended
- Automatic Modified Dietz calculations
- Cash flow-adjusted returns
- 6 benchmark indices built in
- Works with any broker
- Updated in real-time
Tracking performance across multiple brokers? Here's how to see your full portfolio in one place.
Beyond Yearly Returns
Return Breakdown
See exactly where your returns come from:
- Unrealized gains (current holdings)
- Realized gains (sold positions)
- Dividend income
- Each with percentage and amount
Top & Bottom Performers
Identify winners and losers:
- See which assets contributed most to gains or losses
- Toggle between all positions and open only
- Includes closed positions with realized P/L
Frequently Asked Questions
What is the Modified Dietz method?
It's an industry-standard method for calculating portfolio returns that accounts for the timing and size of cash flows (deposits and withdrawals). Unlike simple return calculations, it gives you an accurate picture of your investment performance.
How is CAGR calculated?
CAGR (Compound Annual Growth Rate) shows your annualized return. It's calculated as (Current Value / Total Invested) ^ (1/years) - 1. This tells you the average annual growth rate of your deployed capital.
What does Max Drawdown mean?
Max Drawdown is the largest percentage decline from a peak to a trough in your portfolio's history. For example, if your portfolio peaked at €100,000 and later dropped to €80,000, your max drawdown was 20%. It helps you understand the worst-case scenario you've experienced.
Which benchmarks can I compare against?
Index overlay (MSCI World, S&P 500, NASDAQ-100, STOXX Europe 600, EURO STOXX 50, AEX) is the portfolio benchmark page. This performance page is the yearly TWR table, CAGR, and max drawdown.
Is performance tracking free?
Basic performance metrics are available on the free plan. The full Yearly Performance Table with benchmark comparison, CAGR, and Max Drawdown are Premium features.
Does it work with any broker?
Yes. TrackinV is broker-agnostic — it works with DEGIRO, Interactive Brokers, Trading 212, Saxo, and any other broker. Just import your transactions.
Explore More TrackinV Features
Portfolio Benchmark Comparison
Compare your portfolio against S&P 500, MSCI World, AEX and other major indices with visual charts.
Learn MorePortfolio Analytics & Insights
See where your returns come from, identify top and bottom performers, and track your net cash flow.
Learn MoreDividend Income Tracker
Track all your dividend income, calculate yields, and monitor your passive income growth.
Learn MoreStart Tracking Your Real Returns
Join investors who know exactly how their portfolio performs. Free to start, no credit card required.
Create Free Account